Eastern king prawn stock
Species
- Eastern king prawn (Penaeus plebejus)
Fish stock status
Although a species may be classified as sustainable under the Status of Australian Fish Stocks (SAFS) framework, this does not mean that the stock is meeting Queensland targets under the harvest strategy.
| Stock | 2023 | 2020 | 2018 | 2016 | 2014 |
|---|---|---|---|---|---|
| Eastern Australian | Sustainable | Sustainable | Sustainable | Sustainable | Sustainable |
Stock assessment
Monitoring
Fisheries Queensland collects information on eastern king prawns through the annual Fishery Independent Beam Trawl (FIBT) survey.
The FIBT survey is conducted in key juvenile EKP habitats in southern Queensland waters during the peak recruitment period for the species (November and December).
Locations open to commercial fishing as well as areas that are not fished regularly by the commercial trawl fleet are included in the survey.
The FIBT survey samples prawns before they are available to be caught by the commercial trawl fleet. The index of abundance of recruit eastern king prawns produced by the survey was combined with other available fishery data to assess the status of the stock annually.
Survey results were used in the Biological and Economic Management Strategy Evaluations of the Eastern King Prawn Fishery.
Monitoring area

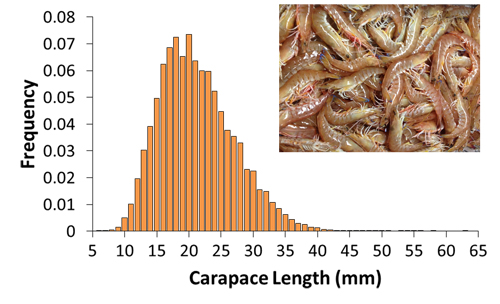
Carapace length
- Prawns ranged from 6mm carapace length (CL) to 65mm CL (Graph 1), with the mode at 20 mm CL
- More than 90% of prawns caught were between 10mm and 30mm CL.
© Queensland Government